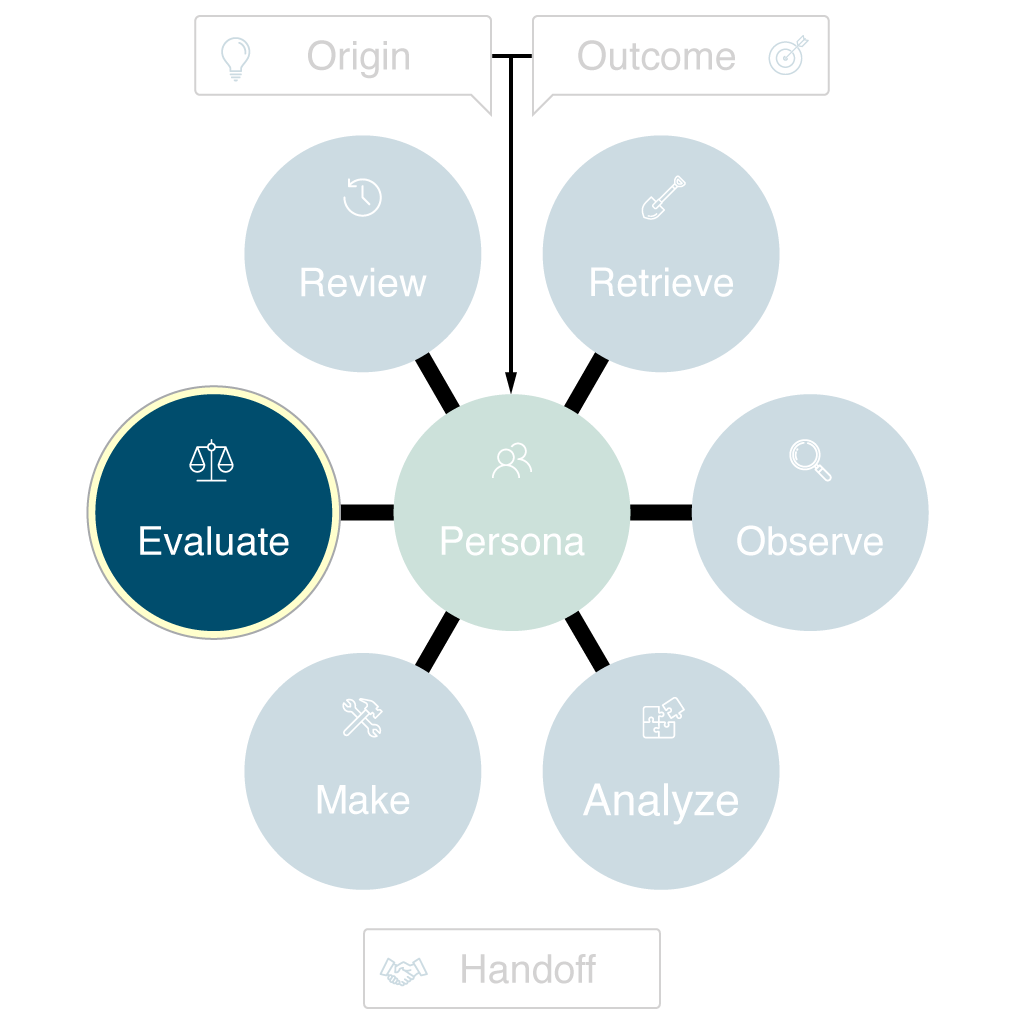
The Evaluate phase tests whether the solution works as intended and meets the defined objectives. This is the most effective time to bring together diverse teams, users, and stakeholders to validate not just the technical solution, but also alignment with user needs, business goals, and cross-functional expectations. Thorough evaluation—grounded in feedback from every perspective—drives transparency, accountability, and continuous improvement.
Purpose
- Test, measure, and validate the effectiveness of the solution using a range of perspectives—users, stakeholders, partners, and delivery teams
- Gather feedback and evidence to understand both what works and what needs to change
- Identify gaps, risks, or unintended outcomes before moving to review or handoff, ensuring all groups are informed
Key Questions
- Does the solution meet the objectives and success criteria for all key groups?
- How do users, stakeholders, or partners respond to the solution? Are their needs and feedback captured?
- What data or feedback are we collecting, and how? Who is responsible for collecting and analyzing?
- What metrics or indicators show effectiveness or failure? Are they visible to the right teams?
- What needs to be improved before review or handoff?
- Are there compliance, accessibility, or quality issues that must be addressed?
- What risks have emerged during testing or evaluation, and who is impacted?
Read the research report on the importance of evaluating work product. [Document Link – PDF]
Case Study Example: Dog Park Finder App (Fetch Spotter)
Applying the Evaluate Phase:
Does the solution meet the objectives and success criteria?
- App launched in target cities with >5,000 downloads in 3 months
- 500+ user reviews submitted in the first quarter
- User surveys show 80% satisfaction with park discovery and review features
How do users or stakeholders respond to the solution?
- Dog owners report the app saves time and helps avoid crowded or poorly maintained parks
- City officials appreciate streamlined feedback and incident reporting
What data or feedback are we collecting, and how?
- In-app survey at 30 and 90 days
- App store reviews and NPS scores
- Feedback from city partners during monthly check-ins
What metrics or indicators show effectiveness or failure?
- Retention and daily active users
- Rate of review submissions and park updates
- Number of flagged issues resolved per week
What needs to be improved before review or handoff?
- Fix user-reported bugs in review submission process
- Expand park coverage based on user location requests
- Begin prioritizing deferred features for future releases (e.g., dog playdate scheduling)
Are there compliance, accessibility, or quality issues?
- Some users report difficulty with color contrast on the map
- Accessibility audit flagged missing alt text for icons
What risks have emerged during testing or evaluation?
- Fake reviews or spam content
- Privacy concerns from city data partners
- Any remaining risks from earlier phases are included in the post-launch review
| Metric / Event Tracked | Platform(s) | Details / Rationale | Timeframe for Measurement |
|---|---|---|---|
| App Downloads & Installs | Google Analytics (GA) | Tracks acquisition and marketing impact | Daily (first 90 days), then weekly and monthly reviews |
| User Registrations | Amplitude, GA | Measures onboarding funnel effectiveness | Daily (first 30 days), then weekly reviews |
| Daily / Monthly Active Users (DAU/MAU) | Amplitude, GA | Monitors app engagement and retention | Daily, Weekly, Monthly |
| Feature Usage (Map, Reviews, Park Details, etc.) | Amplitude | Identifies most/least valuable features | Weekly (launch quarter), then monthly |
| User Review Submissions | Amplitude | Validates user-generated content success | Weekly (first 90 days), then monthly |
| Park Search / Filter Activity | Amplitude | Reveals user journeys and intent | Weekly (launch quarter), then monthly |
| Session Duration & Time on App | Google Analytics | Measures overall engagement and stickiness | Weekly (launch quarter), then monthly |
| Retention at 7, 30, and 90 days | Amplitude | Tracks long-term user value | At 7, 30, 90 days post-registration, then monthly |
| Churn & Uninstall Rate | Amplitude, GA | Identifies drop-off points for re-engagement | Monthly |
| NPS (Net Promoter Score) / In-App User Surveys | HotJar, Amplitude | Captures qualitative user sentiment | At 30 and 90 days, then quarterly |
| App Store / Play Store Ratings & Reviews | Manual + HotJar | Surface external public sentiment | Weekly (first 90 days), then monthly |
| Funnel Drop-Offs (Onboarding, Key Tasks) | Amplitude, GA | Highlights UX friction points | Weekly (launch quarter), then monthly |
| Click & Tap Heatmaps | HotJar | Visualizes user behavior for UI optimization | Weekly (launch quarter), then monthly |
| Bug/Error Reporting & Support Tickets | Amplitude, HotJar | Monitors technical quality and user complaints | Daily (triage), then monthly review |
| Accessibility Events (e.g., font changes) | Amplitude | Verifies inclusion and compliance | Monthly |
| Privacy Consent & Data Policy Events | Google Analytics | Ensures compliance tracking | Quarterly |
Analytics Implementation Plan
Platforms: Amplitude, Google Analytics (GA), HotJar. Most metrics are reviewed daily or weekly in the first 30-90 days post-launch, then move to monthly and quarterly reviews as product matures. Adjust KPIs as needed for new features or business goals.
<< Make Phase
Review Phase >>

